RFC

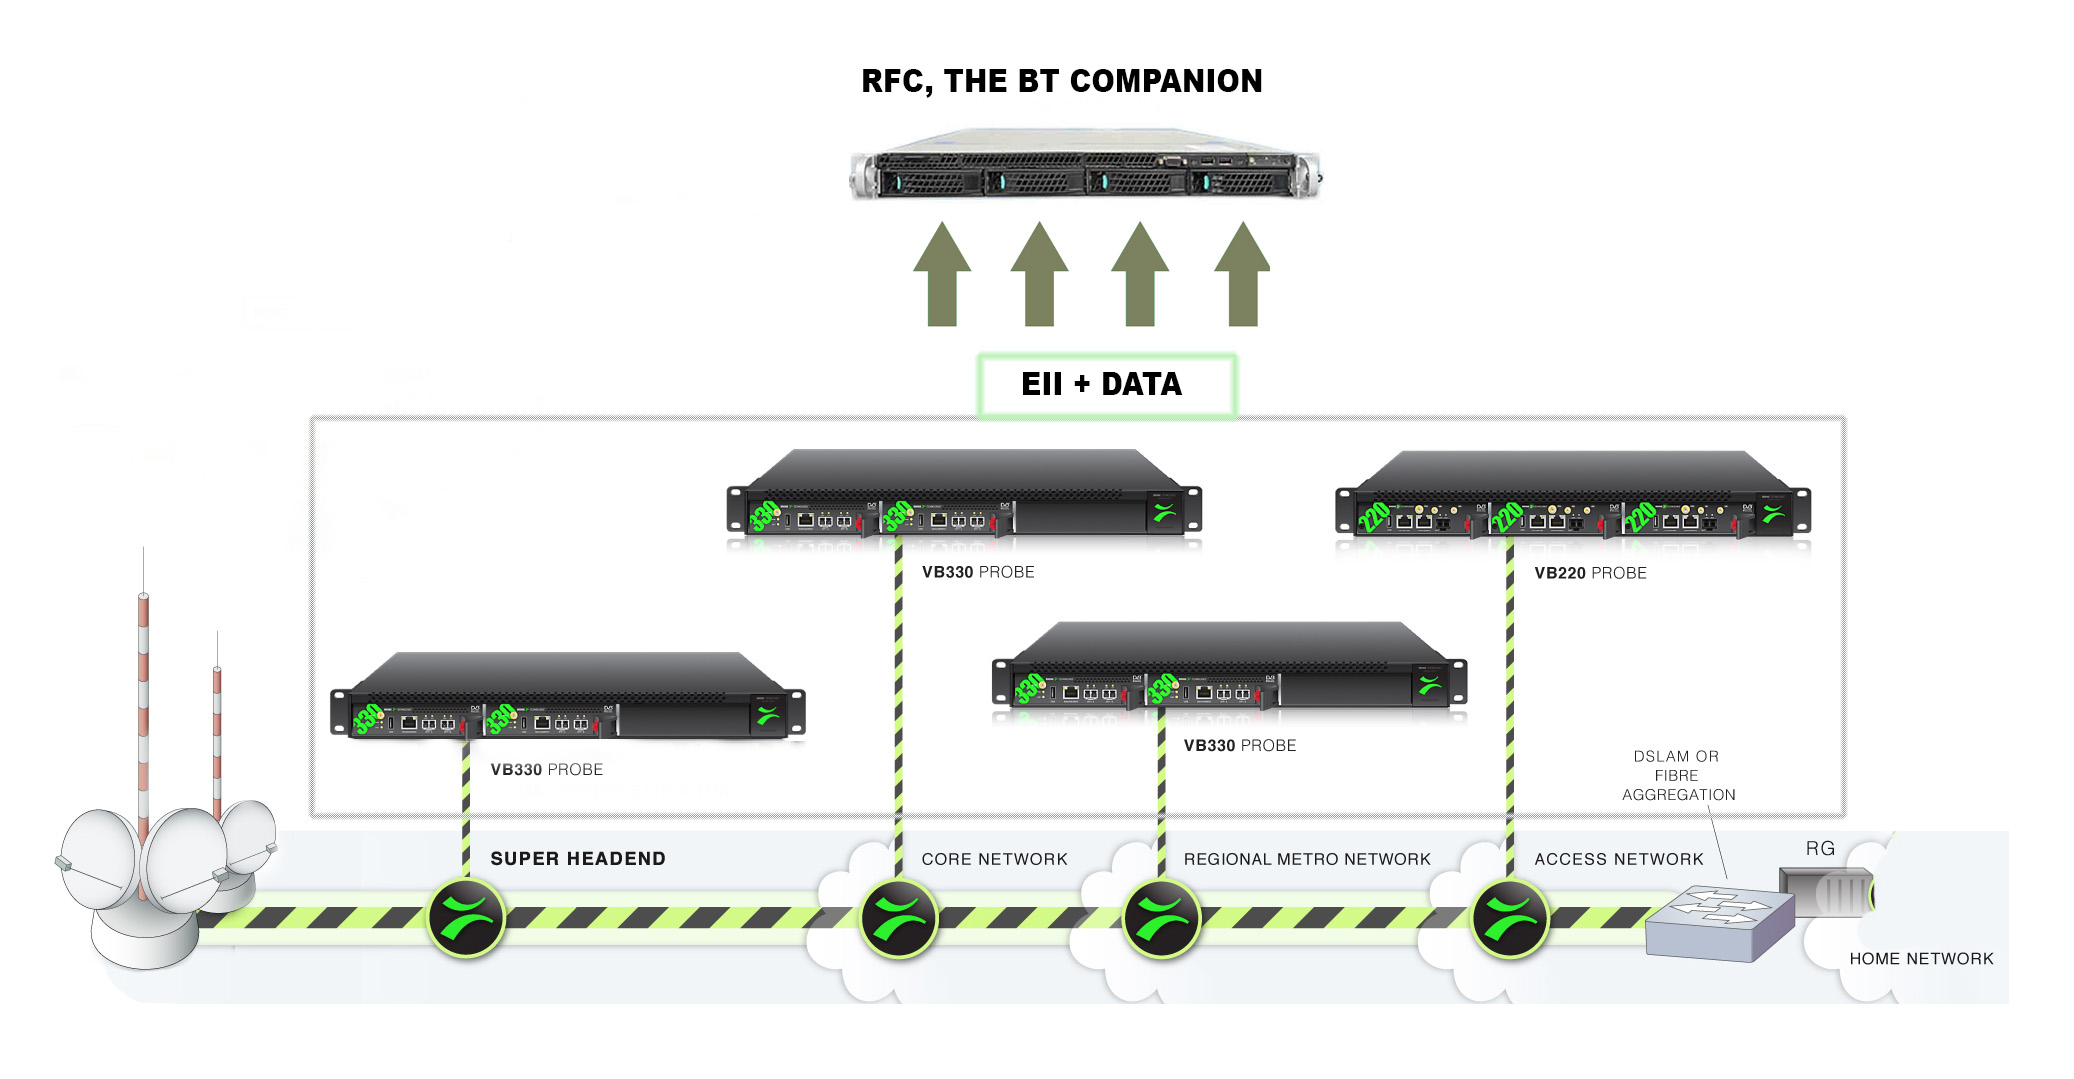
RFC is a companion product for Bridgetech Technologies© VB family of probes. It collects, stores and visualizes the relevant metrics and alarms from the monitored interfaces on the probes and provides either live overview or various historical charts. The web based user interface has been designed to be modern, user friendly and intuitive. It adapts to different devices and screen sizes, from large displays in NOC to small screens on operator's mobile devices.

THE BENEFITS

  • NOC friendly presentation
  • Unified dashboard for each interface type
  • IP and DVB measurement layers
  • ETR101290 based alarms and reports
  • SLA reporting
  • Charts metrics export to CSV / PNG
  • Historic charts for KPI
  • Data retention for historic views
  • Automatic ingest of probe configuration

Realtime:

  • RF signal monitoring
  • Constellation charts (RF)
  • Probe alarms

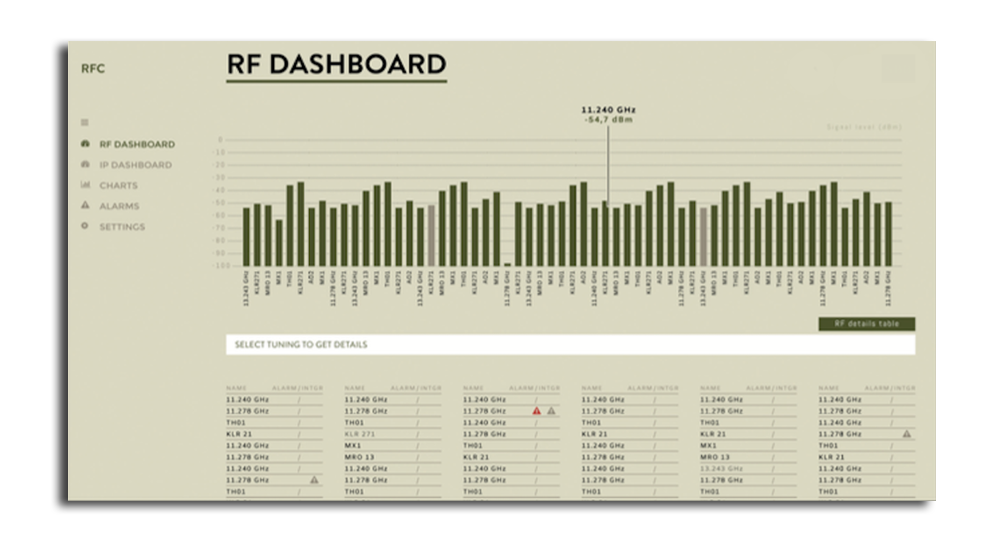
The main benefit of the solution is the unified single view of several interfaces from all the monitored probes at the same time. That means the operator can see all the monitored tunings (e.g. DVB-S/S2 interfaces) from several probes on a single dashboard with all the relevant metrics (on demand). There are specific dashboards for each supported BT© probe interface type (DVB-S/S2, QAM, IP, ASI) that correspond to different physical signal formats. The Charts section is also divided into interface sections as each signal format has its own specfics.

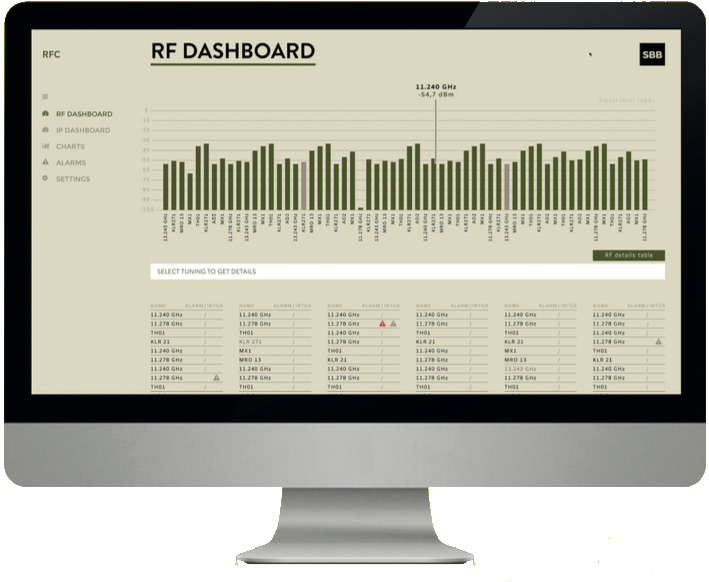
The Dashboard section was designed specifically with focus on NOC demands to display the status of all tunings and any potential alarms with an optional detailed view of any tuning. All data on the dashboards are updated every minute, so the overview of the data is always active/current. The RF Constellation charts are of big help for NOC (i.e. realtime overview) as they are constantly refreshing and show the current vew of all RF interfaces from a specific probe. The RFC offloads the querry traffic from individual probe and assures an uninterrupted signal view which is not available from the probe itself.

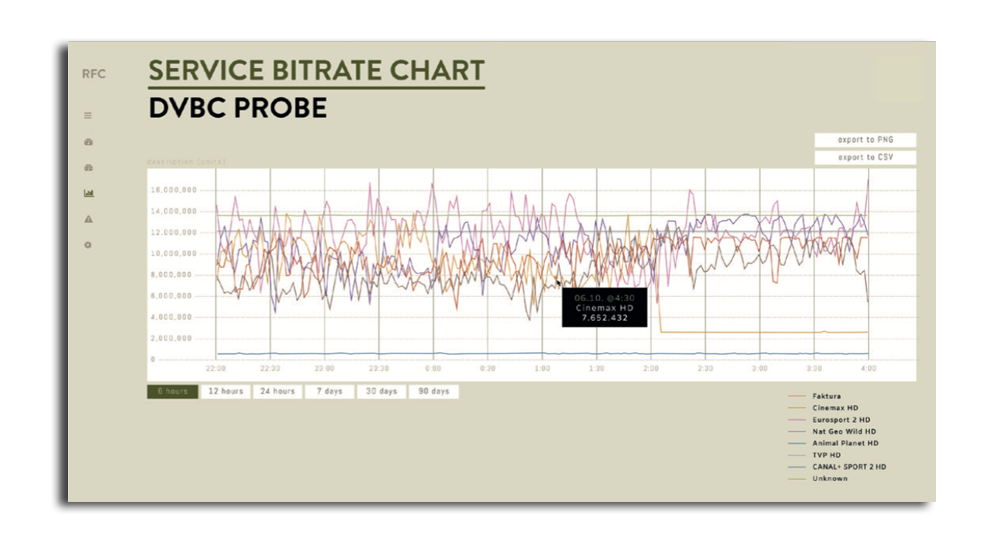
The Charts sections are available for historic analysis of various performance metrics, either for operational needs or for reporting (performance reports, SLA reports). In charts with multiple metrics (e.g. bitrates of several services from a tuning) individual lines can be hidden for better visibility. Either the data in CSV format or the whole chart as a PNG image can be exported. All charts can be zoomed in/out or dragged on the time line to provide either more details or give a trending overview.

DASHBOARDS

Provide the realtime view with optional details for a specific tuning or stream. Dashboards are organized according to the type of monitored interface.

CHARTS

This section consists of historic charts for specific metrics, depending on interface type and the monitored component.

ALARMS

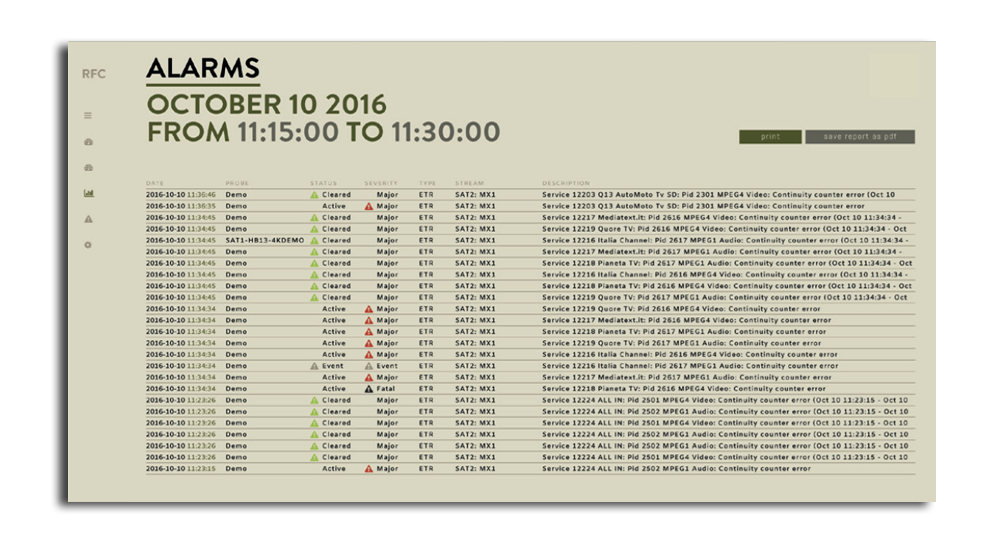
The alarms section can be viewed in a monitoring view with the active alarms shown on the top or as a fully searchable archive of all the probe alarms.

REPORTS

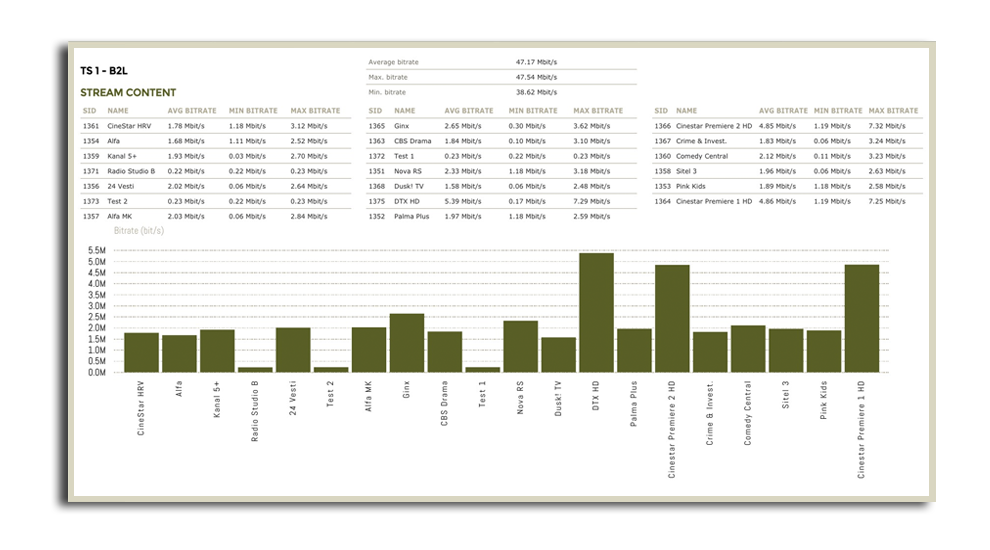
Reports are available for RF interfaces. We can chose either of signal quality or bitrates report.


HOW IT WORKS

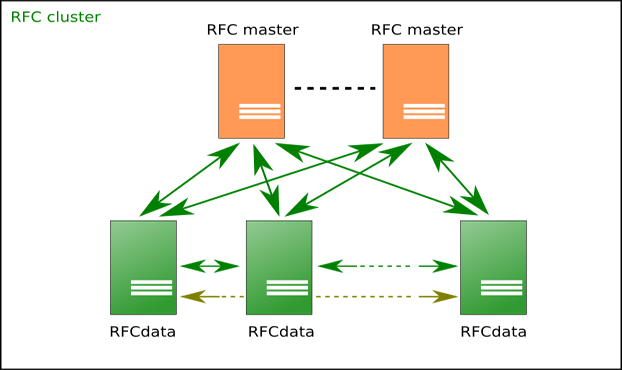
RFC relies on the Eii interface for collecting metrics. Most metrics are collected on a minute interval while some are collected in near-realtime (2 sec interval - e.g. Constellation diagrams). The metrics are then stored for a cofigurable period. The solution consists of two modules - a combined collector/visualizer/data node (RFC master) and a data node (RFCdata node), which extends the storage, availability and search performance of the system. The RFC node can be deployed as a standalone solution for smaller environments and RFCdata nodes can extend the capacity of the system. Each RFC node can collect EII data from up to 10 BT© VB120/220 probes equipped with RF data interfaces and additional RFCdata nodes can be added to build a cluster. In case of larger environment more RFC nodes can be added to the cluster to extend the collector capabilities of the whole system.


ARCHITECTURE AND DEPLOYMENT

The underlying design provides a fully redundant and extensible data layer where loss of any node from the cluster (in cluster mode) doesn’t result in loss of any data. The overall capacity of the system can be easily extended with addition of either RFCdata nodes or in case of more collector points with additional RFC master nodes.

STANDALONE MODE


In smaller environments (up to equivalent of 10 VB120/220 probes) a standalone node is suficient. The standalone RFC node is fully internally redundant to accommodate a potential component loss. The standalone node provides all the necessary functions and can be easily extended to a cluster if the need arises.

CLUSTER MODE


Cluster mode consists of several RFC master and RFCdata nodes joined together in a cluster. Such deployments provide a high level of availability and horizontal scalability (increased storage/retention time) and at the same time increased performance as search queries are extended over all nodes. Such a cluster can grow acording to company needs and environment growth. 
SUPPORTED METRICS AND INTERFACES

SAT IP ASI QAM
SIGNAL LEVEL
  •  
  •  
  • RF PARAMETERS (Eb/N0, MER, SNR)
  •  
  •  
  • BER
  •  
  •  
  • STREAM EFFECTIVE BITRATES
  •  
  •  
  •  
  •  ,
  • SERVICE BITRATES
  •  
  •  
  •  
  •  
  • PID BITRATES
  •  
  •  
  •  
  •  
  • OTHER PID BITRATES
  •  
  •  
  •  
  •  
  • CC ERRORS
  •  
  •  
  •  
  •  
  • IAT (Inter Arrival Time)
  •  
  • ALARMS
  •  
  •  
  •  
  •  
  • REPORT
  •